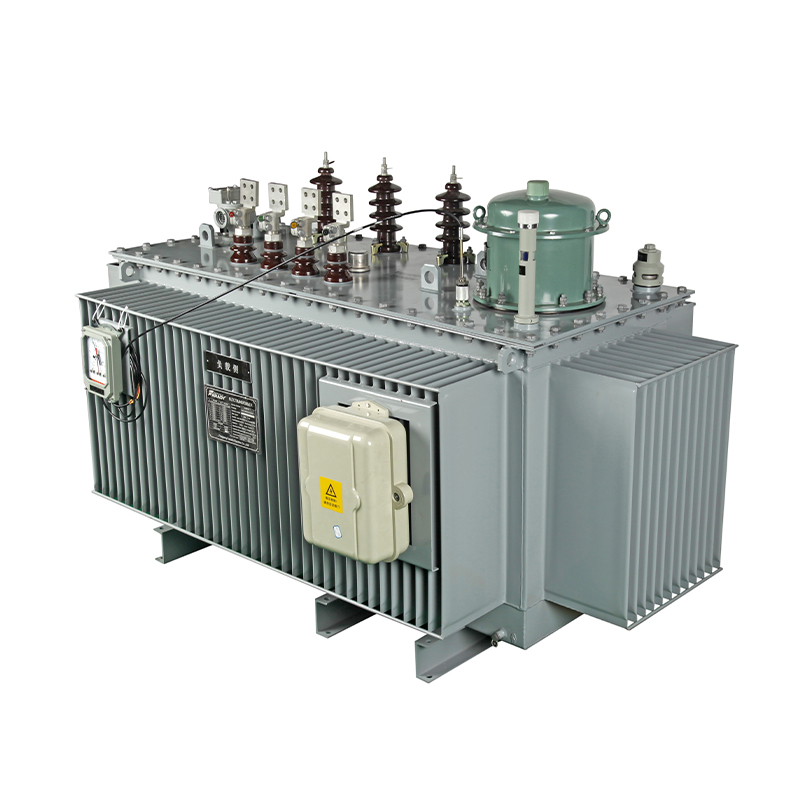
Efficiency Metrics for Step Voltage Regulators
Compensate for voltage drops caused by line resistance and varying loads (e.g., residential peak demand).
Maintain end-user voltage within ANSI/IEEE C84.1 limits (typically 114–126 V for 120 V systems).
Reduce energy losses in downstream conductors by optimizing voltage levels.
Full-Load Efficiency: Measured at 100% of rated kVA (e.g., 1000 kVA for a 1000 kVA SVR) and nominal tap position (typically 0% regulation). This reflects performance under peak load, critical for systems with high demand.
Part-Load Efficiency: Measured at 50%, 25%, or 10% of rated load, as SVRs often operate at partial load (e.g., nighttime residential feeders). Part-load efficiency is crucial because distribution systems average 30–60% load factor, making this the dominant operating condition.
Core Loss (Iron Loss): Caused by hysteresis and eddy currents in the core, core loss is relatively constant across load levels (since it depends on voltage, not current). It is measured during open-circuit tests at rated voltage. For SVRs, core loss varies slightly with tap position due to changes in magnetic flux distribution in the autotransformer core.
Copper Loss (Load Loss): Arises from resistance in the windings and tap changer contacts, varying with the square of the load current (I²R). Copper loss increases with load and depends on tap position, as different taps engage different winding sections, altering effective resistance.
Tap Change Loss: A unique loss in SVRs, occurring during tap transitions (mechanical arcing or solid-state switching losses). This transient loss is small per cycle but accumulates in systems with frequent tap changes (e.g., feeders with rapidly fluctuating loads like electric vehicle charging stations).
Peak Efficiency: The load level (typically 40–60% of rated load) where efficiency is maximized, aligning with typical distribution feeder load factors.
Efficiency Flatness: A desirable trait where efficiency remains high across a wide load range (e.g., 30–100% load), ensuring minimal losses under varying conditions.
Open-Circuit Test: Measures core loss by applying rated voltage to the primary winding with the secondary open. For SVRs, this test is repeated at multiple tap positions to capture variations in core loss.
Short-Circuit Test: Measures copper loss by applying a reduced voltage to induce rated current in the windings (secondary shorted). Tests are conducted at each tap position to map load loss across the regulation range.
Load Test: Directly measures input/output power at various load levels (25%, 50%, 75%, 100%) using precision power analyzers (±0.1% accuracy) to calculate efficiency.
Tap Change Loss Testing: Uses high-speed data loggers to capture transient current/voltage waveforms during tap changes, calculating energy loss per transition (typically in joules). This is repeated for 100+ cycles to average out variability.
Cyclic Load Testing: Simulates daily load profiles (e.g., morning/evening peaks) to measure total energy loss over a 24-hour period, reflecting real-world operating conditions.
Higher Regulation Steps: Taps that inject more voltage (e.g., +10%) engage longer winding sections, increasing resistance and copper loss. For example, an SVR at +10% tap may have 15–20% higher copper loss than at 0% tap.
Tap Changer Type: Mechanical tap changers (with arcing contacts) have higher contact resistance than solid-state changers, increasing copper loss. However, solid-state changers introduce switching losses at each tap change.
Load Current: Copper loss dominates at high loads, while core loss is dominant at low loads. Thus, SVRs are most efficient at moderate loads (40–60% rated current).
Harmonic Content: Non-linear loads (e.g., inverters, LED lighting) introduce harmonics, increasing eddy current losses in windings and core. This can reduce efficiency by 1–3% in highly distorted feeders.
Core Material: Amorphous alloy cores reduce core loss by 30–50% compared to traditional CRGO steel, improving no-load efficiency.
Winding Conductivity: High-purity copper windings (101% IACS) lower resistance, reducing copper loss versus standard copper or aluminum.
Cooling System: Overheating increases winding resistance (copper resistivity rises with temperature). Efficient cooling (e.g., finned enclosures for pad-mounted SVRs) maintains lower operating temperatures, preserving efficiency.
Energy Savings: A 1% efficiency improvement in a 2 MVA SVR operating at 50% load saves ~876 kWh/year (calculated as 2,000 kVA × 0.5 load × 8,760 hours × 0.01 loss reduction). For a utility with 1,000 SVRs, this totals ~876,000 kWh/year.
Reduced Operating Costs: Lower losses decrease heat generation, extending insulation life and reducing maintenance (e.g., tap changer servicing).
Improved Voltage Stability: Efficient SVRs maintain voltage regulation with minimal energy waste, supporting higher penetration of distributed energy resources (e.g., rooftop solar) that cause voltage fluctuations.
Peak Efficiency: Increased from 96.2% to 98.5% at 50% load.
Annual Loss Reduction: 12,000 kWh per SVR, totaling 600,000 kWh/year for the fleet.
Voltage Regulation Efficiency: Improved from 92% to 98% (percentage of time within ±1% of setpoint) due to faster, lower-loss tap changes.
Relate Products
Relatenews
- Step Voltage Regulators: Key Specifications to Know 2025-09-05 15:31:00
- The Future of Step Voltage Regulators in Smart Grids 2025-08-25 08:16:00
- Efficiency Metrics for Step Voltage Regulators 2025-07-19 08:45:00
- Step Voltage Regulators: Addressing Voltage Flicker in Welding Operations 2025-07-08 17:49:00
- Application and Challenges of step voltage regulator in Ocean Engineering 2024-12-26 15:41:41
- Seismic performance evaluation and reinforcement suggestions for step voltage regulator 2024-12-26 15:41:39
- Compact Design and Space Optimization Scheme of step voltage regulator 2024-12-26 15:41:38
- Discussion on the Integration of Intelligent Manufacturing and Industrial Internet of Step by step voltage regulator 2024-12-26 15:41:37


